Multislice Method for Thick Specimens
The ptychography method in electron microscopy models interaction between the illuminated probe and the specimen under investigation mathematically as having a multiplicative property. In this case, for each overlapping scanning point during the acquisition processes, we can formulate the exit wave that passes through the specimen as the result of a multiplication between the entrance wave and the specimen transfer function. Suppose the specimen transfer function denoted as \(\mathbf{X} \in \mathbb{C}^{N \times N}\) and the illuminated probe as \(\mathbf{P}_s \in \mathbb{C}^{N \times N}\) with scanning point index \(s\) and total scanning points \(s \in [S]\). Hence, the intensity of diffraction patterns observed at scanning point \(s \) is given by
$$
\mathbf{I}_s = |\mathcal{F}(\mathbf{P}_s \circ \mathbf{X})|^2 \in \mathbb{R}^{N \times N},
$$
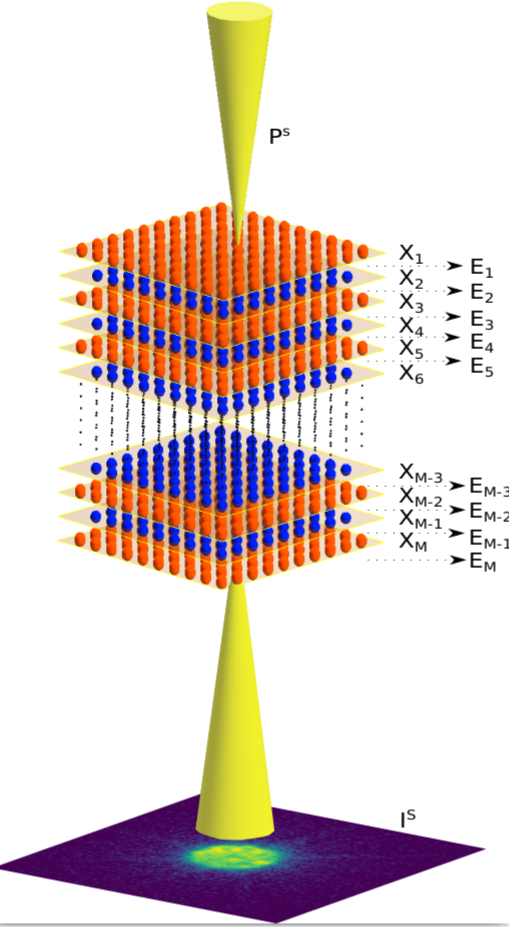
where the symbol \(\circ\) denotes the element-wise multiplication or Hadamard product. As discussed earlier in the previous article, this model is oversimplified and neglects scattering processes that occurred between the electron and the atom inside the specimen. Several approaches to address the limitation of this model exist in the literature, namely using the Blochwave and the multislice model [1,2,3]. In this article, we focus on the latter, where according to the definition, the multislice method models the thick specimen as a collection of several thin slices of the specimen under observation, as presented in the figure below.

One of the disadvantages of the current forward model is that it is difficult to separate the illuminated probe and the specimen transfer function as a single entity, since the Fresnel propagation entangles the process between probe and object. In our recent preprint [5], we propose a reformulation of the classical multislice method. Therefore, we can model the specimen under test as a single matrix and disentangle the probe's illumination. Furthermore, we also proposed two optimization-based algorithms to estimate the specimen under test.

One of the disadvantages of the current forward model is that it is difficult to separate the illuminated probe and the specimen transfer function as a single entity, since the Fresnel propagation entangles the process between probe and object. In our recent preprint [5], we propose a reformulation of the classical multislice method. Therefore, we can model the specimen under test as a single matrix and disentangle the probe's illumination. Furthermore, we also proposed two optimization-based algorithms to estimate the specimen under test.
References:
[1] The scattering of electrons by atoms and crystals. I. A new theoretical approach
[2] Diffraction contrast of electron microscope images of crystal lattice defects - II. The development of a dynamical theory
[3] Advanced computing in electron microscopy
[4] Ptychographic transmission microscopy in three dimensions using a multi-slice approach
[5] Inverse Multislice Ptychography by Layer-wise Optimisation and Sparse Matrix Decomposition